Log Anomaly Detection
 Photo by Markus Spiske on Unsplash
Motivation
The log anomaly detection project uses a convolutional neural network (CNN) model to detect anomalous log messages. The project was completed during the Master of Data Science (MDS) degree at UBC with Mitch Harris and was completed over a four week period concurrent with a deep learning course.
The project was interesting as it provided the opportunity to work with unstructured system log data (something I hadn’t previously considered as using for a dataset) and the use of a CNN on non-imagery data. CNNs are typically used with imagery data for tasks such image classification (what is the image of… a cat!), object detection and segmentation (there’s a car in an image and it’s located in the lower quadrant of the image), and facial recognition. This article assumes a high-level understanding of CNNs (or at least neural networks) but a good overview of CNNs can also be found here.
Code and additional details on the project are available in this github repo.
Data
Hadoop Distributed File System (HDFS) log data was used in this project to test the log anomaly detector. Hadoop provides distributed processing of data using multiple machines and generates a large amount of log data during use. The data are provided by Loghub which maintains a collection of system logs freely accessible for research purposes.
- Shilin He, Jieming Zhu, Pinjia He, Michael R. Lyu. Loghub: A Large Collection of System Log Datasets towards Automated Log Analytics. Arxiv, 2020.
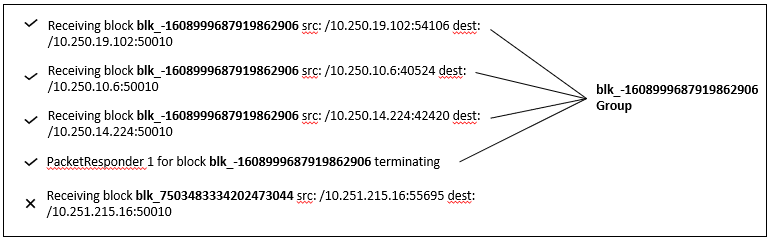
The HDFS data set consists of block ids and each of these block ids have already been labelled as normal or anomalous. All of the log messages with the same block id form a sequence of log messages for that id. An example of HDFS log data is shown below indicating the first four logs as part of one block id and the fifth log as part of a different block id.
The HDFS data used in the study can be found here and additional details are provided in the paper:
- Wei Xu, Ling Huang, Armando Fox, David Patterson, Michael Jordan. Detecting Large-Scale System Problems by Mining Console Logs, in Proc. of the 22nd ACM Symposium on Operating Systems Principles (SOSP), 2009.
The HDFS data were split into training and testing sets on the unstructured log file prior to log parsing. The split was done with the first 80% of the logs forming the training data and the remaining 20% as the test data. This ordered split was done instead of a random split for following reasons:
- Multiple log lines form a single HDFS block id. Randomly splitting the raw log data would result in incomplete block event sequences split between the train and test sets.
- The HDFS log data are sequential and time-series based in nature. Therefore, using a sequential split of the data better represents non-experimental conditions in terms of evaluating model performance.
The following table provides a summary of the training and testing datasets.
| Dataset | Log Messages | HDFS Blocks | Anomalous Blocks | Percent Anomalous |
|---|---|---|---|---|
| Train | 8,940,503 | 315,602 | 9,825 | 3.11% |
| Test | 2,235,126 | 120,537 | 1,983 | 1.64% |
| Total | 11,175,629 | 436,139 | 11,808 | 2.70% |
The datasets are very imabalanced with minimal anomalous block ids compared to normal block ids.
Log Anomaly Detector
The components of the log anomaly detector include the following:
- Parse: Parsing the unstructured HDFS log data into a structured format consisting of log event templates and log variables. Grouping of log messages for each HDFS block id is then performed to create a sequence of events for each id.
- Feature Extraction: Term frequency-inverse document frequency (TF-IDF) with sliding windows to generate 2D feature matrices for each block id.
- Log Anomaly Detection Model: Supervised CNN model using the feature matrices as inputs and trained using the labelled log data (normal/anomalous).
Parse
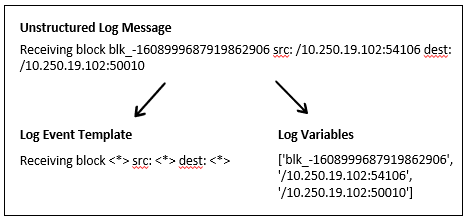
Log messages are in an unstructured format and consist of a log event template and the log variables within a template. An example of an unstructured log message is: PacketResponder 1 for block blk_38865049064139660 terminating. Log parsing typically involves identifying the event template and variable components of each message and extracting them to create a structured format.
Traditional methods for parsing log files include using hand-crafted statements based on domain knowledge but these are time intensive and need constant modification. Instead, automated log parsing aims to reduce the effort of manual parsing. This project uses the Drain automatic log parser available through the Logparser toolkit.
- Jieming Zhu, Shilin He, Jinyang Liu, Pinjia He, Qi Xie, Zibin Zheng, Michael R. Lyu. Tools and Benchmarks for Automated Log Parsing. International Conference on Software Engineering (ICSE), 2019.
- Pinjia He, Jieming Zhu, Zibin Zheng, and Michael R. Lyu. Drain: An Online Log Parsing Approach with Fixed Depth Tree. IEEE International Conference on Web Services (ICWS), 2017.
The raw unstructured HDFS log data is parsed to generate structured data in the form of log event templates and log variables as shown below. This resulted in 46 unique event templates which are just labelled E1 to E46 for the study.
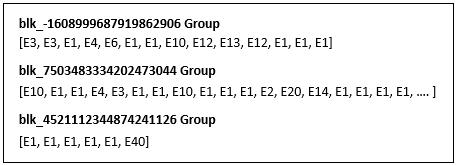
The extracted log variables are then used to group logs by their HDFS block ids. This creates a sequence of log events for each block id.
Feature Extraction
Feature extraction is then performed for each HDFS block id sequence of events using the following steps:
Step 1: Event Counts/TF-IDF: A count of the event templates in each block id grouping is compiled. The total counts of each event template across all block id groups is also compiled and term frequency-inverse document frequency (TF-IDF) is then applied resulting in a TF-IDF vector for each block id.
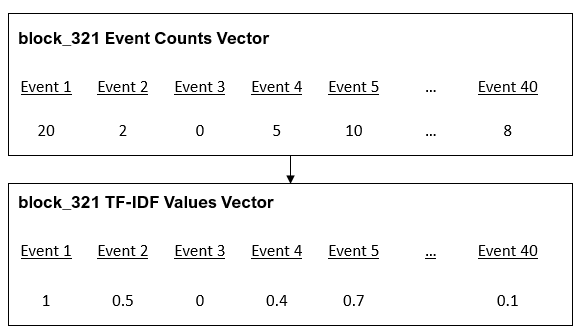
The purpose of applying TF-IDF is to provide a measure that considers the total count of an event template and not just a measure solely based on the event counts within a block id group of log messages. TF-IDF is typically used in natural language processing to help reflect how important a word is in a document. Wikipedia provides a good description. The idea is that it could potentially help the CNN better identify infrequent log messages related to anomalies and is an approach that has been used in other log anomaly detection methods.
Step 2: Sliding Window Event Counts: A sliding and overlapping window that subsets the sequence of events within each block id is then applied. The event counts within each subset selection are used to generate a matrix for each block id. Each subset of event counts represents a row in the matrix.
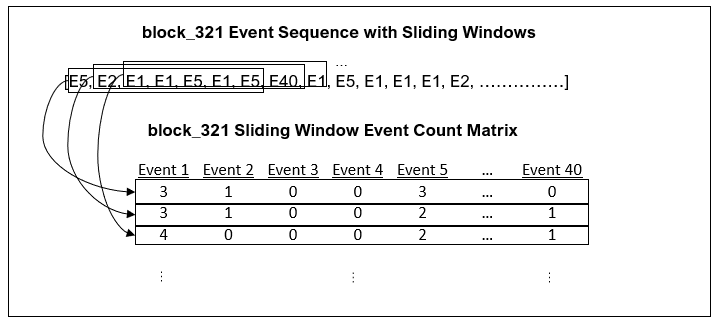
The purpose of applying the sliding window event counts is to try and capture the sequential history of the events within a block id. If no windowing was used, the matrix would simply be 1D with a single row representing the event counts within the entire block id. The overlapping window allows a larger matrix to be generated for the CNN compared with using non-overlapping windows.
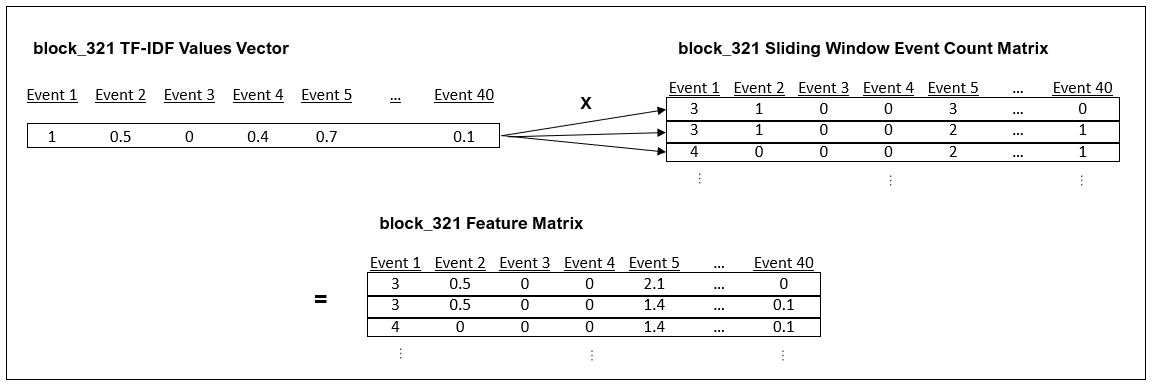
Step 3: Final Feature Matrix: The block id sliding window event count matrices (from Step 2) are then multiplied by the corresponding block id TF-IDF vectors (from Step 1). This results in matrices based on TF-IDF values instead of event counts.
This feature extraction process is similar to the approach used in the LogSpy anomaly detector.
- H. Li and Y. Li. LogSpy: System Log Anomaly Detection for Distributed Systems. 2020 International Conference on Artificial Intelligence and Computer Engineering (ICAICE), 2020.
Model
The selection of the CNN for the project was largely driven by self-interest in applying a supervised neural network approach to the project and we weren’t concerned if the method was not ultimately successful (driven by interest instead of performance). A literature review also indicated that CNNs have been used successfully on log anomaly detection and it seemed like a reasonable approach to try.
Using the CNN was interesting as it provided the opportunity to use a model typically used for images but applied to log messages instead. The 2D matrices generated in the feature extraction process described above basically represent the ‘images’ for the CNN. It seemed reasonable that a CNN could be trained to pick out log events within a feature matrix that represented an anomaly, much like a CNN could be trained to find a red ball in an image. The columns in the feature matrices provided the representation for the different log event positioning and the sliding windows provided positioning of where log events occurred within the HDFS block id.
The CNN architecture selected for the project used a generic setup as follows:
- Two convolutional layers (16 and 32 filters with 2x2 kernels) with max pooling (2x2 kernels)
- Two multilayer perceptron (MLP) hidden layers (120 and 84 nodes)
- An output layer with two nodes representing normal and anomalous labels
- The convolutional and MLP layers use ReLU activation and the output layer uses softmax
The model was trained in a supervised approach using the normal/anomalous labels from the training dataset. The original plan was to try alternative architectures if needed but the initial performance was high enough that modifications were not required.
Results
The results from the HDFS log data including performance metrics on the anomaly labels are provided in the following tables.
| TRAINING | True Normal | True Anomalous |
| Model Normal | 305,731 | 22 |
| Model Anomalous | 46 | 9,808 |
| TESTING | True Normal | True Anomalous |
| Model Normal | 118,553 | 5 |
| Model Anomalous | 1 | 1978 |
| Precision (%) | Recall (%) | F-Score (%) | |
|---|---|---|---|
| TRAINING | 99.5 | 99.8 | 99.7 |
| TESTING | 99.9 | 99.7 | 99.8 |
The results indicate the CNN applied to the feature extraction matrices is a good approach for anomaly detection on the HDFS log data. However, while the metrics show extremely high performance it should be noted that similar performance has been achieved using typical machine learning models in other studies. Therefore, the approach should likely be considered as viable but not necessarily better than other methods.
Conclusion
The project provided an interesting opportunity to use a CNN on non-imagery data and resulted in a viable approach for log anomaly detection on HDFS data. Future study using this approach could look at:
- The viability of applying the methodology to other log data types. There are other labelled log data available in Loghub that could be used to complete this additional study. Hyperparameter tuning on feature matrix extraction parameters and model parameters could be completed if performance of the model is not as high as observed in this experiment.
- Improvements to the model could include a method to classify unseen log events using natural language processing to determine the most similar log event.
- Different CNN architectures could also be explored or the output from the convolutional layers could also be input to a variety of machine learning models instead of the multi-layer perceptron layers used in this study.
The method of using feature matrices that are capable of representing time within the CNN could also be tried on other time-series datasets and would be interesting to explore.
It should also be recognized that this project does not aim to provide the optimal method for log anomaly detection. Multiple log anomaly detection models have been recently explored using various architectures (LSTMs, isolation forests, etc.) as well as the use of various feature extraction techniques with NLP and Auto-Encoders. Some of these methods may lend themselves to better real-world application of log anomaly detection such that the models do not require training labels (which can be difficult or time consuming to obtain) and can easily handle unseen log event templates.
If you have any questions not answered in this article or the github repo, please feel free to reach out!
Nathan Smith
Data Scientist
Solving problems using data science coupled with a background in water resource engineering.